
Interpreting Oregon Coast Trends From a North Coast Lens
December 4, 2025
December 4, 2025
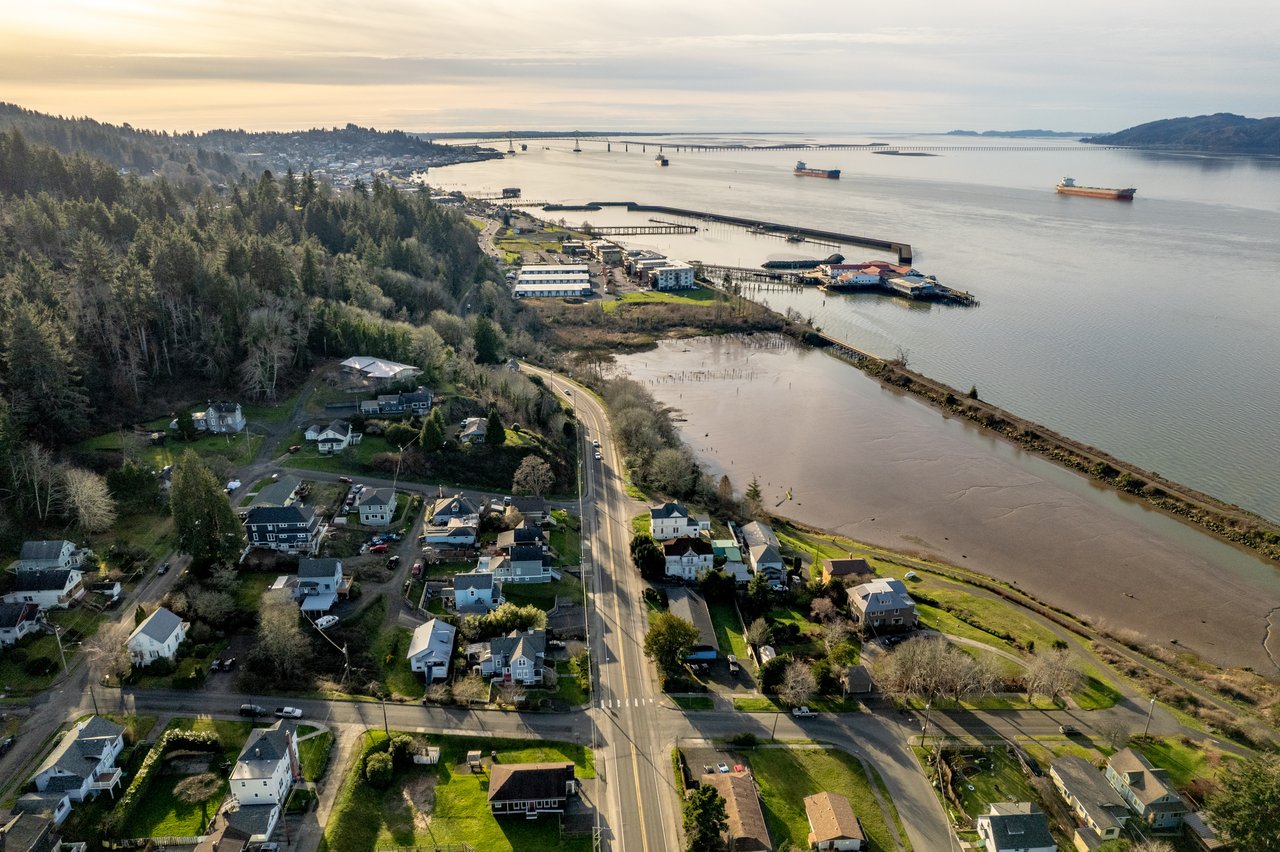
Statewide housing headlines can be helpful, but they rarely tell you what is happening in Astoria or across Clatsop County. If you are weighing a purchase, sale, or investment on the North Oregon Coast, you need a translation that fits small, seasonal, second‑home‑heavy markets. In this guide, you will learn how to read the data through a local lens so you can move with confidence. Let’s dive in.
Coastal towns behave differently than larger metro areas. A few forces shape the North Coast more than statewide averages:
Statewide stories from sources like Oregon REALTORS are a good starting point. To make them useful here, break them down by town and price band, and always account for seasonality and short‑term rental activity.
Inventory is the count of active listings, often shown as months of supply. On the North Coast, inventory whipsaws because there are fewer homes. Use rolling 3‑ or 12‑month views from sources like RMLS Market Action and segment by price band. Entry‑level inventory in Astoria can move very differently than premium oceanfront homes in Cannon Beach.
What to watch:
DOM tracks time to an accepted offer. It often lengthens in fall and winter when fewer buyers are active, then shortens sharply in spring and summer. A long DOM is not always weak demand. Some sellers simply wait to engage until tourist season brings more eyes.
Pair DOM with:
Medians are your friend in small markets. A few high‑end sales can skew averages. Also compare price per square foot and list‑to‑sale ratio to understand negotiation dynamics.
Local patterns to consider:
Sales counts show throughput. On the coast, track both unit counts and dollar volume. You can see fewer transactions but higher dollar totals when more premium properties close. Use rolling 12‑month totals to smooth seasonal spikes.
Months of supply helps you see buyer or seller leverage. It is most useful when you apply it to submarkets, not the entire county. Compare Astoria under $600k to Cannon Beach over $1 million rather than averaging everything together.
Watch the flow. New listings tend to rise before peak season. Cancellations and reductions cluster in the off‑season. These patterns reflect owners timing around tourism and rental calendars.
Short‑term rentals can meaningfully affect inventory and pricing in resort towns. Look at occupancy and average daily rates from tools like AirDNA and verify local rules on city sites such as Cannon Beach. For investors, analyze revenue on a 12‑month basis, not just summer.
Remote work and retiree interest changed who shops the coast. Use the U.S. Census Bureau and local surveys to understand where buyers are coming from and what they seek. Astoria tends to attract a mix of year‑round residents and remote workers, while resort towns lean more toward second homes.
Check where it is rising. Metro areas can drive state averages while North Coast supply stays tight in popular price bands. Pull a 12‑month rolling inventory view by town and price band on RMLS Market Action. Also separate year‑round listings from properties oriented to the STR market.
Premium coastal micro‑markets can be resilient due to limited supply, views, and cash purchases. In Cannon Beach and parts of Seaside, prices may hold even when the statewide median softens. Astoria’s mid‑range bands can behave differently, often with steadier movement. Use medians by town and band, and compare list‑to‑sale ratios.
Rates matter most to first‑time and local buyers. In second‑home segments with larger down payments or cash purchases, demand may be less rate sensitive. Split your analysis by financing type and price tier when reviewing local market reports.
Coastal buildable land is limited by zoning, hazard zones, and permitting processes managed under Oregon’s coastal program. Review permitting and site constraints with Clatsop County and the DLCD. Most near‑term new builds land at higher price points.
The North Coast benefits from in‑migration, but the mix varies by town. Astoria can pull more year‑round residents and remote workers, while resort towns attract vacation buyers. The Oregon Office of Economic Analysis and the Census Bureau provide useful context for these flows.
Spring and summer bring more listings, showings, and closings. DOM shortens and the best listings move quickly. In fall and winter, listings thin, DOM rises, and price reductions become more common. Median prices often look higher in late summer when more premium and STR‑oriented properties transact.
If you are evaluating STR potential, build your case on a full‑year view. Compare peak‑season revenue to off‑season occupancy using sources like AirDNA. Then confirm city registration and transient occupancy tax requirements with local offices such as Astoria and Clatsop County.
A year‑round community with a mix of primary residences and investment properties. Seasonality still matters, but volatility is usually calmer than in resort‑heavy towns. Watch mid‑price bands closely and compare DOM trends by neighborhood.
A pronounced second‑home and STR market with premium pricing for oceanfront and walkable locations. Cash purchases are common, and prime listings tend to cluster around spring and summer. Regulations and registration for STRs are important to understand.
A diverse mix of year‑round residents and visitors that can show more frequent turnover. Inventory can feel tight in the most popular areas near the beach and amenities. Price bands behave differently, so segment your comps.
Smaller scale and often quieter outside of peak season. Listings and sales can swing month to month. Use rolling averages and compare ocean‑proximity segments.
A blend of primary and second homes with pockets of premium properties. Pay attention to list‑to‑sale ratios and DOM around the peak months.
Buying or selling on the North Coast is about timing, segmentation, and local rules. When you work with a concierge, town‑by‑town approach, you can turn statewide noise into clear next steps. If you want a data‑backed plan tailored to your property or search, connect with Andrea Mace for a local, white‑glove consultation.


A mix of affordable options, high end neighborhoods and great access to amenities.
clatsop county
Sleepy Gearhart By the Sea is full of nuanced charm.
Want to sell now or in the future? Let's start a conversation about how my services can be put to use to market and sell your home to a qualified buyer.